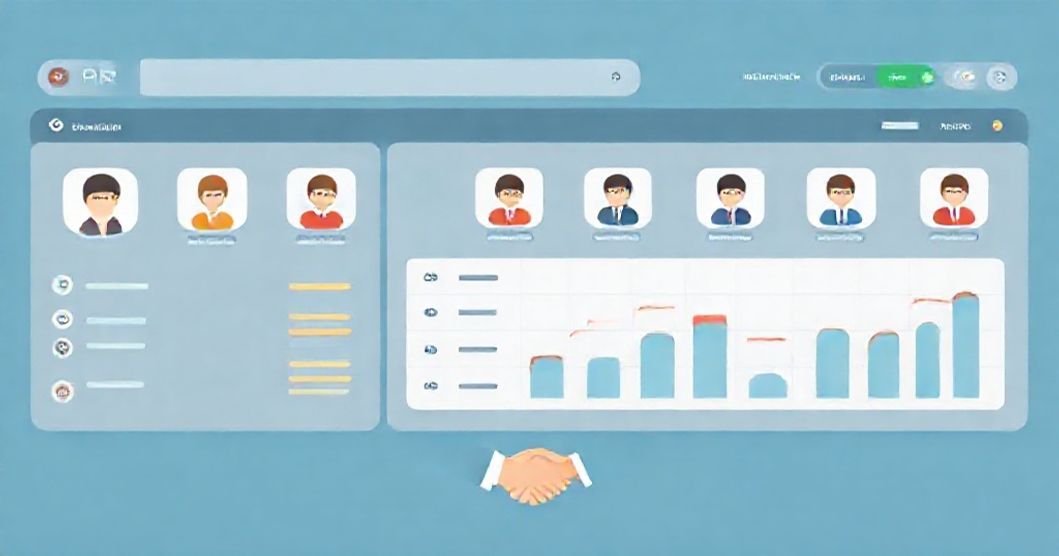
In today's competitive business landscape, your CRM (Customer Relationship Management) system is more than just a contact database—it's the nerve center of your sales operation. Yet according to recent research, only 40% of sales teams say they're effectively using their CRM data to drive performance improvements. The difference between high-performing sales teams and struggling ones often comes down to one critical factor: how effectively they visualize and act on CRM data through well-designed dashboards.
A properly configured CRM dashboard transforms raw data into actionable insights, helping sales managers identify bottlenecks, forecast revenue accurately, prioritize high-value opportunities, and coach their teams to peak performance. This comprehensive guide will walk you through everything you need to build a CRM dashboard that maximizes your sales pipeline performance in 2026.
Key Takeaways
- ✅ Maintain 3-5× pipeline coverage to confidently hit sales targets with proper margin of safety
- ✅ Track stage-by-stage conversion rates to identify the biggest bottlenecks in your sales funnel
- ✅ Use pipeline velocity metrics to optimize deal size, win rate, and sales cycle length simultaneously
- ✅ Implement predictive lead scoring with demographic and behavioral data to prioritize high-potential opportunities
- ✅ Create role-specific dashboards for executives, managers, and reps with relevant KPIs for each stakeholder
Why Your Sales Team Needs a Custom CRM Dashboard
While most CRM platforms like Salesforce, HubSpot, and Pipedrive offer basic reporting, custom dashboards provide several critical advantages:
Real-Time Pipeline Visibility
See exactly where every deal stands in your pipeline, identify stalled opportunities immediately, and take corrective action before deals slip away. High-performing sales teams review their pipeline daily, not weekly.
Predictable Revenue Forecasting
Move beyond gut-feel forecasting to data-driven predictions based on historical win rates, deal velocity, and pipeline coverage. Accurate forecasting enables better resource allocation and strategic planning.
Performance Benchmarking
Compare individual rep performance against team averages and top performers. Identify coaching opportunities, recognize high achievers, and diagnose performance issues before they impact revenue.
Data-Driven Decision Making
Replace subjective opinions with objective data when making critical decisions about territory assignments, compensation structures, marketing investments, and sales process improvements.
Key stat: Companies with advanced sales analytics capabilities achieve 73% higher revenue growth and 5.3× higher ROI on marketing spend compared to those with basic reporting, according to Aberdeen Group research.
Essential CRM Dashboard Metrics: Pipeline Health
Your sales pipeline is the lifeblood of your revenue engine. These metrics provide early warning signs of problems and opportunities:
| Metric | Description | Target Benchmark |
|---|---|---|
| Pipeline Value | Total value of all open opportunities | 3-5× quarterly quota |
| Pipeline Coverage Ratio | Pipeline value / Sales target | 3:1 to 5:1 |
| Weighted Pipeline | Pipeline value × stage probability | 1.5-2× quota |
| Average Deal Size | Total pipeline value / number of deals | Industry-dependent |
| Pipeline Velocity | (Deals × Deal Value × Win Rate) / Sales Cycle Length | Increasing trend |
💡 Understanding Pipeline Coverage
Pipeline coverage is your margin of safety. If you have a $1M quarterly quota and a 25% historical win rate, you need $4M in pipeline ($1M ÷ 0.25) to confidently hit your target.
Best practice: Track pipeline coverage by stage. You should have 3× coverage in early-stage opportunities and 1.5× in late-stage deals. If coverage drops below these thresholds, intensify prospecting efforts immediately.
Pipeline Distribution by Stage
A healthy pipeline shows balanced distribution across stages. Here's what ideal distribution looks like:
| Pipeline Stage | Ideal % of Pipeline | Warning Signs |
|---|---|---|
| Prospecting/Qualification | 30-40% | Below 25% = insufficient lead generation |
| Needs Analysis/Demo | 25-30% | Above 40% = qualification issues |
| Proposal/Negotiation | 20-25% | Stagnant deals = pricing or value issues |
| Verbal Commit/Contracting | 10-15% | Above 20% = slow closing process |
Lead Scoring & Qualification Metrics
Not all leads are created equal. Effective lead scoring helps sales teams focus on opportunities most likely to convert, improving efficiency and win rates.
Implementing Predictive Lead Scoring
Demographic Scoring (Company Fit)
- Company Size: Employee count within your ICP (Ideal Customer Profile)
- Industry Vertical: Match with your target industries
- Revenue Range: Annual revenue indicating budget capacity
- Geographic Location: Territories you can effectively serve
- Technology Stack: Using complementary or competitive tools
Behavioral Scoring (Engagement Level)
- Website Visits: Number and recency of site visits
- Content Downloads: Whitepapers, case studies, guides consumed
- Email Engagement: Open rates, click-through rates, replies
- Event Participation: Webinar attendance, conference meetings
- Product Trials: Demo requests, free trial signups, feature usage
Lead Qualification Framework (BANT)
Track these critical qualification criteria in your CRM dashboard:
- Budget: Does the prospect have allocated budget? Timeline for budget availability?
- Authority: Are you engaged with decision-makers or champions? Who else is involved?
- Need: Is there a clear, urgent business problem your solution addresses?
- Timeline: What's driving urgency? When do they need to implement?
Dashboard metric: Track "% of deals with complete BANT qualification" by stage. Deals entering proposal stage should have 100% BANT qualification. If you're proposing to unqualified opportunities, you're wasting valuable selling time. Integrate with your marketing attribution dashboard to see which channels deliver the highest-quality leads.
Deal Progression & Win Rate Analytics
Understanding how deals move through your pipeline and where they get stuck is critical for sales process optimization.
| Metric | How to Calculate | Target Benchmark |
|---|---|---|
| Overall Win Rate | (Won Deals / Total Closed Deals) × 100 | 20-30% (B2B SaaS) |
| Stage Conversion Rate | (Deals Advanced / Deals in Stage) × 100 | Varies by stage |
| Average Sales Cycle Length | Average days from first touch to close | 30-90 days (varies) |
| Deal Velocity | Average days spent in each stage | Decreasing trend |
| Stale Deal % | Deals with no activity in 30+ days | Below 15% |
🎯 Optimizing Stage-by-Stage Conversion
Identify your conversion "leak points" by tracking conversion rates between each pipeline stage:
- MQL to SQL: Target 40-50% (marketing qualified to sales qualified)
- SQL to Opportunity: Target 30-40%
- Opportunity to Proposal: Target 50-60%
- Proposal to Closed-Won: Target 40-50%
The stage with the lowest conversion rate is your biggest opportunity for improvement. Focus coaching and process refinement on that specific stage.
Win/Loss Analysis
Track why you win and lose deals to continuously improve your approach:
Common Win Reasons
- Superior product features/functionality
- Better pricing/value proposition
- Stronger relationships with decision-makers
- Faster implementation timeline
- More comprehensive customer support
Common Loss Reasons
- Price too high (track how often vs. actual value delivered)
- Lost to specific competitors (which ones most often?)
- No decision/status quo (often indicates poor qualification)
- Budget constraints (timing issue or true budget problem?)
- Missing key features (product roadmap priorities)
Sales Forecasting Accuracy Metrics
Accurate revenue forecasting is critical for resource planning, investor relations, and strategic decision-making. Your CRM dashboard should track forecast accuracy and highlight prediction errors.
Forecasting Methodologies
| Forecast Method | How It Works | Best Use Case |
|---|---|---|
| Stage-Based | Apply historical win rate % to each stage | Stable, predictable sales process |
| Opportunity-Based | Sum of individual rep forecasts | Complex deals with variable timing |
| Historical Trends | Project based on past performance patterns | Seasonal businesses |
| AI/Predictive | Machine learning analyzes multiple signals | Large datasets, 100+ deals/month |
📊 Measuring Forecast Accuracy
Forecast Accuracy Formula: (Actual Revenue / Forecasted Revenue) × 100
Target: 90-95% accuracy by month-end (within 5-10% variance)
Best practice: Track forecast changes throughout the quarter. If your forecast drops significantly in the final weeks, it indicates poor pipeline visibility or sandbagging. If it consistently rises, reps may be too conservative or hiding pipeline.
Commit Categories
Segment your pipeline into forecast categories for more granular visibility:
- Closed-Won: Deals already closed (100% probability)
- Commit: High confidence deals (90%+ probability) - verbal agreement, legal review
- Best Case: Moderate confidence (50-75% probability) - proposal stage, negotiating
- Pipeline: Early stage opportunities (10-40% probability) - still qualifying
- Omitted: Deals you're not counting on (below 10% probability)
Sales Activity Metrics & Performance KPIs
Activity metrics are leading indicators that predict future pipeline health and revenue outcomes. Track these to ensure your team is executing the right behaviors.
| Activity Metric | Description | Benchmark (per rep/day) |
|---|---|---|
| Calls Made | Outbound prospecting calls | 40-60 for SDRs |
| Emails Sent | Personalized prospecting emails | 50-80 for SDRs |
| Meetings Booked | Qualified discovery calls scheduled | 2-4 for SDRs |
| Demos Completed | Product demonstrations delivered | 3-5 for AEs |
| Proposals Sent | Formal proposals/quotes delivered | 2-3 per week for AEs |
⚡ Activity-to-Outcome Ratios
Understanding conversion between activities helps identify efficiency improvements:
- Calls to Conversations: Target 25-30% connection rate
- Conversations to Meetings: Target 20-25% booking rate
- Meetings to Opportunities: Target 30-40% conversion
- Opportunities to Closed-Won: Target 20-30% win rate
Individual Rep Performance Dashboard
Create individual dashboards for each sales rep showing:
- Quota Attainment: % of quota achieved (target: 100%+)
- Pipeline Generation: New pipeline created this period
- Average Deal Size: Compared to team average
- Win Rate: Personal win rate vs. team benchmark
- Sales Cycle Length: How quickly they close deals
- Activity Metrics: Calls, emails, meetings vs. targets
Coaching insight: Reps below quota with low activity need motivation and accountability. Reps with high activity but low results need skills coaching on qualification, discovery, or closing techniques. Combine CRM data with B2B marketing metrics for complete visibility into lead quality and conversion rates.
Customer Relationship Health Metrics
Your CRM dashboard shouldn't just track new sales—it should monitor the health of existing customer relationships to maximize retention and expansion revenue.
Account Health Indicators
Product Adoption & Usage
- Login Frequency: Daily active users (DAUs) / Monthly active users (MAUs)
- Feature Adoption: % of customers using advanced features
- Time to Value: Days until customer realizes first value
- Usage Trends: Increasing, stable, or declining engagement
Customer Satisfaction Signals
- NPS Score: Net Promoter Score (target: 50+)
- CSAT Score: Customer Satisfaction (target: 4.5+/5)
- Support Tickets: Volume and severity of issues raised
- Executive Engagement: Frequency of QBR meetings, executive sponsor calls
Churn Risk Indicators
Identify at-risk accounts before they churn:
| Risk Signal | What to Monitor | Action Trigger |
|---|---|---|
| Declining Usage | 30%+ drop in active users or login frequency | Immediate CSM outreach |
| No Executive Contact | No exec engagement in 60+ days | Schedule QBR within 2 weeks |
| Low NPS/CSAT | Score below 6 (NPS) or 3 (CSAT) | Executive intervention |
| Payment Issues | Failed payments, downgrade requests | Investigate budget/value concerns |
| Support Escalations | 3+ critical tickets in 30 days | Product/engineering review |
Retention metric: Track "Customer Health Score" (weighted combination of usage, satisfaction, and engagement metrics). Flag accounts with scores below 60/100 for proactive intervention.
Revenue Expansion & Upsell Tracking
For SaaS and subscription businesses, expansion revenue (upsells, cross-sells, upgrades) often drives higher profitability than new customer acquisition.
| Expansion Metric | Formula | Target Benchmark |
|---|---|---|
| Net Revenue Retention (NRR) | ((Starting ARR + Expansion - Churn) / Starting ARR) × 100 | 110-130% (best-in-class) |
| Expansion MRR | Revenue from upgrades, add-ons, additional seats | 20-30% of new MRR |
| Cross-Sell Rate | (Customers buying 2+ products / Total customers) × 100 | 30-50% |
| Upsell Conversion Rate | (Upsell opportunities closed / Total opportunities) × 100 | 40-60% |
💰 Expansion Playbook Triggers
Automate expansion opportunity identification based on customer behavior:
- Usage Threshold: Customer hits 80% of plan limits → Upgrade conversation
- Feature Requests: Customer asks about advanced features → Cross-sell opportunity
- Team Growth: Customer adds team members → Seat expansion
- High Engagement: Power users with high NPS → Reference customer, case study
- Contract Renewal: 90 days before renewal → Multi-year, additional products
Building Your CRM Dashboard: Best Practices
Now that you understand which metrics to track, here's how to structure your CRM dashboard for maximum effectiveness:
Dashboard Hierarchy
1. Executive Dashboard (CEO/CRO Level)
- Revenue vs. target (actual, forecast, variance)
- Pipeline coverage ratio
- Win rate trends
- Forecast accuracy
- Customer acquisition cost (CAC)
- Customer lifetime value (LTV)
2. Sales Manager Dashboard
- Team quota attainment
- Individual rep performance rankings
- Pipeline health by stage
- Deal velocity and cycle time
- Activity metrics by rep
- Win/loss analysis
3. Individual Rep Dashboard
- Personal quota progress
- My pipeline value and stage distribution
- Upcoming activities and follow-ups
- Deals requiring attention (stale, at-risk)
- My activity metrics vs. targets
- Commission tracker
Dashboard Design Principles
- Start with Goals: What decisions will this dashboard inform? Design backwards from decisions to metrics.
- Prioritize the Vital Few: Focus on 5-7 critical metrics per dashboard. Avoid information overload.
- Use Visual Hierarchy: Most important metrics at the top, larger font, prominent placement.
- Enable Drill-Down: Click high-level metrics to see underlying details (e.g., click win rate to see win/loss reasons).
- Show Trends: Display trends over time, not just point-in-time snapshots. Are things improving or declining?
- Color Code Intelligently: Green = on target, yellow = caution, red = urgent action needed.
- Mobile Optimization: Ensure dashboards are readable on mobile devices for on-the-go access.
Sales Pipeline Performance Dashboard: Tracking Full-Funnel Revenue
Your sales pipeline isn't just a list of deals — it's a real-time revenue prediction engine. A dedicated sales pipeline performance dashboard gives you end-to-end visibility from initial lead capture through closed-won revenue, helping you identify exactly where deals accelerate, stall, or leak out of your funnel.
In 2026, the query "sales pipeline performance" has surged in search volume as more revenue leaders demand granular pipeline analytics beyond what basic CRM reports offer. Here's how to build a pipeline performance view that drives action.
Pipeline Stage Conversion Waterfall
The most powerful pipeline dashboard widget is a stage-by-stage conversion waterfall. Based on 2026 B2B benchmarks, here are the conversion rates to measure yourself against:
2026 Pipeline Stage Benchmarks
- MQL to SQL: 18-22% average, top performers reach 25-35%
- SQL to Opportunity: 50-62% average across B2B SaaS
- Opportunity to Proposal: 50-60% for well-qualified pipelines
- Proposal to Closed-Won: 15-30%, with median win rate at 21%
If any stage falls below these ranges, that's where your coaching and process improvement should focus.
Pipeline Velocity by Segment
Pipeline velocity measures how fast revenue moves through your funnel. The formula — (Number of Deals × Average Deal Value × Win Rate) ÷ Sales Cycle Length — should be tracked by segment to reveal where your pipeline generates revenue most efficiently. In 2026, AI-powered CRM platforms can calculate this automatically and flag when velocity drops for a specific segment, deal size, or rep.
Stalled Deal Detection
Configure your pipeline dashboard to automatically flag deals that have been in the same stage longer than your average cycle time for that stage. Research shows that CRM systems can accelerate sales cycles by 8-14% through better data accessibility — but only if your team acts on stalled-deal alerts before opportunities go cold. Set up automated notifications when a deal exceeds 1.5× the average stage duration.
Revenue Leakage Analysis
Track where deals exit your pipeline and why. Your dashboard should visualize lost-deal reasons by stage, helping you answer: Are you losing on price at the proposal stage? Are competitors winning during evaluation? Are deals ghosting after the demo? This analysis directly informs your sales playbook and competitive positioning.
CRM Dashboard Benchmarks for 2026
The CRM landscape has shifted significantly heading into 2026. The global CRM market has grown to $126.17 billion, with 91% of companies with 10+ employees now using CRM systems. Cloud-based CRMs account for 80% of all deployments. Yet the performance gap between top-performing and average sales teams continues to widen.
Here are the key benchmarks your CRM dashboard should measure against in 2026:
Sales Performance Benchmarks
- Average B2B win rate: 21% overall (31% for SMB, 15% for enterprise deals over $100K ACV)
- Top-performer win rate: 35-40%+ with superior qualification and multi-stakeholder engagement
- CRM ROI: $8.71 returned for every $1 spent, with most businesses seeing positive ROI within 12 months
- Sales productivity lift: Up to 34% improvement with properly configured CRM dashboards
- Forecast accuracy: 60-75% with traditional methods vs. 90-98% with AI-native forecasting platforms
AI-Powered Pipeline Forecasting in 2026
The biggest shift in CRM dashboards for 2026 is the integration of AI-driven forecasting. Traditional manual forecasting delivers 60-75% accuracy at best, while AI-native platforms now achieve 90-98% precision. Organizations adopting AI-powered pipeline analytics report a 15-20% improvement in forecast accuracy, 25% shorter sales cycles, and up to 30% improvement in quota attainment.
The best practice in 2026 is a hybrid approach: combine AI predictions with rep confidence scores, allow override mechanisms with justification, and create feedback loops where human corrections improve model accuracy. With 83% of companies already using AI features in their CRM for smarter automation and personalized interactions, teams that haven't adopted AI-assisted pipeline analytics are falling behind.
Predictive Lead Scoring Dashboards: The 2026 Standard
Predictive lead scoring has shifted from experimental to mainstream in 2026. AI-powered scoring models now analyze behavioral signals, firmographic data, and third-party intent feeds in real time — replacing the static, rule-based point systems that dominated CRM workflows for the past decade. The result: sales teams can handle up to 10x more lead volume without adding headcount, while focusing effort on prospects most likely to convert.
Modern AI scoring systems need at least 100-200 historical leads with known outcomes to identify initial conversion patterns. Once trained, they continuously learn from new data — every closed-won deal, lost opportunity, and engagement signal refines the model automatically. Over 79% of CRM users now recognize AI-powered scoring as essential to their sales stack, up from roughly 50% just two years ago.
Key Predictive Scoring Metrics to Dashboard
- AI Score Distribution: Visualize how leads are bucketed across score ranges (hot, warm, cold) to ensure healthy top-of-funnel volume
- Score-to-Close Correlation: Validate that higher-scored leads actually close at higher rates — if not, retrain the model
- Intent Signal Volume: Track third-party intent data (G2 research, content consumption, competitor visits) feeding into scores
- Time-to-Contact by Score Tier: Measure how quickly reps engage high-score leads — best-in-class teams respond within 5 minutes
- Model Accuracy Rate: Track prediction accuracy monthly; target 80%+ for mature models
The dashboard advantage here is clear: instead of reps manually reviewing lead lists, your CRM dashboard surfaces the highest-probability opportunities at the top, with real-time score changes triggering alerts when a prospect's buying intent spikes. Pair predictive scoring with your marketing ROI dashboard to trace which channels generate the highest-scoring leads at the lowest acquisition cost.
Agentic CRM Analytics: Autonomous Dashboard Intelligence
The next frontier for CRM dashboards in 2026 is agentic analytics — AI agents that don't just display data but autonomously act on it. Unlike traditional dashboards that wait for a human to spot a problem, agentic CRM systems detect anomalies, diagnose root causes, and recommend (or execute) corrective actions in real time.
Here's what agentic CRM analytics looks like in practice: an AI agent notices that deal velocity in your mid-market segment has slowed by 18% over the past two weeks. It cross-references CRM activity logs and identifies that demo-to-proposal conversion dropped because two reps haven't been sending follow-up proposals within 48 hours. The agent flags the insight to the sales manager, drafts a suggested coaching action, and optionally triggers an automated follow-up sequence for the stalled deals — all before anyone opens a dashboard.
Agentic Dashboard Capabilities to Evaluate
- Anomaly Detection: Automatic alerts when any metric deviates beyond normal variance (pipeline drops, win rate changes, activity dips)
- Root Cause Analysis: AI drills into why a metric changed — was it a specific rep, deal segment, lead source, or stage?
- Prescriptive Actions: Suggested next steps with estimated impact (e.g., "Re-engage 12 stalled deals to recover $340K in pipeline")
- Automated Workflows: Trigger CRM automations directly from dashboard insights — reassign leads, update deal stages, or send nurture sequences
The CRM market is projected to reach $128-$320 billion by the early 2030s (depending on the forecast), with AI-powered analytics driving the fastest-growing segment. Teams that adopt agentic CRM dashboards now gain a compounding advantage: every action the AI takes generates data that further improves its recommendations. For a deeper look at how AI agents are reshaping marketing analytics, see our guide on agentic AI marketing dashboards.
Build Your CRM Dashboard with 1ClickReport
Creating a comprehensive CRM dashboard that connects to Salesforce, HubSpot, Pipedrive, and other sales tools—while calculating complex metrics like pipeline velocity, forecast accuracy, and customer health scores—typically requires weeks of development and ongoing maintenance.
1ClickReport eliminates the complexity. Our platform automatically connects to your CRM and related systems, calculates all the metrics outlined in this guide, and presents them in beautiful, customizable dashboards tailored to executives, managers, and individual reps. No SQL queries, no spreadsheets, no manual data entry.
Join our waitlist today and get 60% off when we launch! Transform your sales operations with data-driven insights that drive revenue growth.
Conclusion: Data-Driven Sales Excellence
The difference between sales teams that consistently exceed quota and those that struggle often comes down to visibility, accountability, and data-driven decision-making. A well-designed CRM dashboard provides all three.
By implementing the metrics and best practices outlined in this guide, you'll gain:
- Real-time pipeline visibility that prevents revenue surprises
- Predictable forecasting that enables confident resource planning
- Performance insights that identify coaching opportunities
- Early warning systems that flag at-risk deals and accounts
- Expansion intelligence that maximizes customer lifetime value
Start by implementing the core metrics—pipeline coverage, win rate, deal velocity, and forecast accuracy—then progressively add more sophisticated tracking as your sales operations mature. Remember: the goal isn't to track everything possible, but to track what drives decisions and actions.
With the right CRM dashboard, every member of your sales organization—from reps to the CRO—has the insights they need to maximize performance and drive predictable revenue growth in 2026 and beyond.
Frequently Asked Questions
What CRM metrics should sales teams track?
Sales teams should track pipeline value, pipeline coverage ratio (3-5× quota), weighted pipeline, win rate (20-30% for B2B SaaS), average deal size, sales cycle length, and conversion rates at each stage. Also monitor activity metrics like calls made, demos completed, and proposals sent to ensure team execution.
How do I calculate pipeline coverage?
Pipeline coverage = Total Pipeline Value / Sales Target. For example, with a $1M quarterly quota and 25% historical win rate, you need $4M in pipeline ($1M ÷ 0.25 = $4M). Best practice: maintain 3-5× coverage for early-stage deals and 1.5-2× for late-stage opportunities.
What's a healthy sales win rate?
A healthy win rate for B2B SaaS is 20-30% overall. Track win rate by stage: MQL to SQL (40-50%), SQL to Opportunity (30-40%), Opportunity to Proposal (50-60%), and Proposal to Closed-Won (40-50%). Win rates vary by industry, deal size, and sales cycle length.
How do I forecast revenue from my CRM?
Use multiple forecasting methods: Stage-based (apply historical win rates to each pipeline stage), Opportunity-based (sum of rep forecasts), Historical trends (project based on past patterns), or AI/Predictive (machine learning for large datasets). Target 90-95% forecast accuracy by month-end. Segment pipeline into Closed-Won, Commit (90%+), Best Case (50-75%), Pipeline (10-40%), and Omitted (below 10%).
What's the difference between MQL and SQL?
MQL (Marketing Qualified Lead) meets marketing's criteria for lead score, ICP fit, and engagement level. SQL (Sales Qualified Lead) is an MQL that sales has contacted and confirmed meets BANT criteria (Budget, Authority, Need, Timeline). Typical conversion: 20-30% of MQLs become SQLs after sales qualification.
How do I track sales cycle length?
Track average days from first touch to close for the total sales cycle, plus time spent in each stage. B2B SaaS cycles typically range 30-90 days depending on deal size. Monitor by lead source, deal size, and industry to identify patterns. Use pipeline velocity formula: (Deals × Value × Win Rate) / Cycle Length to measure efficiency.
Can I integrate my CRM with marketing automation?
Yes, integrating CRM with marketing automation (HubSpot, Marketo, Pardot) enables full-funnel tracking from first touch to closed revenue. This integration allows lead scoring, automated nurture campaigns, multi-touch attribution, and complete visibility into which marketing efforts drive pipeline and revenue. Most modern platforms offer native integrations or connect via tools like Zapier.